Showing posts with label Infra Testing. Show all posts

Saturday, August 2, 2025

๐Ÿ” Tools and Technologies I Use for Digital Forensics Investigations


Digital forensics
 plays a critical role in modern cybersecurity — whether it’s responding to a data breach, investigating insider threats, or performing incident analysis after suspicious behavior. In my work as a security-minded engineer and DevSecOps practitioner, I’ve frequently had to identify, collect, and analyze digital evidence across endpoints, servers, and cloud environments.

In this blog post, I’ll walk you through the tools and technologies I rely on to conduct effective digital forensics investigations — categorized by use case.


๐Ÿง  What Is Digital Forensics?

At its core, digital forensics is about identifying, preserving, analyzing, and reporting on digital data in a way that’s legally sound and technically accurate. The goal is to reconstruct eventsidentify malicious activity, and support security incident response.


๐Ÿงฐ My Go-To Tools for Digital Forensics Investigations


๐Ÿ—‚️ Disk & File System Analysis

These tools help examine hard drives, deleted files, system metadata, and more:

  • Autopsy (The Sleuth Kit) – A GUI-based forensic suite for analyzing disk images, file recovery, and timelines.

  • FTK Imager – For creating and previewing forensic images without altering the original evidence.

  • dd / dc3dd – Command-line tools to create low-level forensic disk images in Linux environments.

  • EnCase (Basic familiarity) – A commercial powerhouse in forensic investigations, used primarily for legal-grade evidence analysis.


๐Ÿงฌ Memory Forensics

Memory (RAM) often holds short-lived but critical evidence, like injected malware, live sessions, or loaded processes.

  • Volatility Framework – Extracts details like running processes, DLLs, command history, network activity, and more from memory dumps.

  • Rekall – An alternative memory analysis framework focused on automation and deep system state inspection.

✅ I’ve used Volatility to trace injected PowerShell payloads and enumerate hidden processes in live incident simulations.


๐ŸŒ Network Forensics

Capturing and analyzing network traffic is essential for spotting data exfiltration, command-and-control activity, or lateral movement.

  • Wireshark – Industry standard for packet analysis and protocol dissection.

  • tcpdump – Lightweight CLI tool to capture traffic in headless environments or remote systems.

  • NetworkMiner – Parses PCAP files to extract files, sessions, and credentials automatically.


๐Ÿ“Š Log & Timeline Analysis

Understanding what happened — and when — is key to reconstructing incidents.

  • Timesketch – A timeline analysis tool for visualizing and collaborating on event data.

  • Log2Timeline (Plaso) – Converts log files, browser histories, and system events into structured timelines.

  • Sysinternals Suite – Includes gems like ProcmonPsExec, and Autoruns for Windows incident response.


๐Ÿงช Malware Analysis (Static & Dynamic)

Understanding what a file does — before or while it runs — helps detect advanced threats and APT tools.

  • Ghidra – Powerful open-source reverse engineering tool from the NSA for analyzing executables.

  • x64dbg / OllyDbg – Popular debuggers for inspecting Windows executables.

  • Hybrid Analysis / VirusTotal – Cloud-based tools to scan files and observe sandbox behavior.

  • Cuckoo Sandbox – An open-source automated sandbox for observing malware behavior in a VM.


☁️ Cloud & Endpoint Forensics

Modern investigations often span cloud platforms and remote endpoints:

  • AWS CloudTrail, GuardDuty – Audit user and API activity in cloud environments.

  • Microsoft Azure Defender – For cloud-native threat detection and log correlation.

  • CrowdStrike Falcon / SentinelOne – Endpoint Detection and Response (EDR) tools for retrieving artifacts, hunting threats, and isolating compromised machines.


๐Ÿงฐ Scripting & Automation

Scripting accelerates collection, triage, and analysis — especially in large-scale environments.

  • Python – I use it to build custom Volatility plugins, PCAP parsers, or automate alert triage.

  • Bash / PowerShell – For live memory dumps, log gathering, process inspection, and rapid automation.


๐Ÿงฉ MITRE ATT&CK & DFIR Methodology

I map artifacts and behaviors to MITRE ATT&CK techniques (e.g., T1055 – Process Injection) to align with industry standards and communicate findings effectively.

I also follow established methodologies like:

  • SANS DFIR process

  • NIST 800-61 Incident Handling Guide

  • Custom playbooks for containment, eradication, and recovery

✅ Summary: Digital Forensics Tools I Use

๐Ÿ”น Disk & File System Analysis

  • Autopsy (Sleuth Kit) – GUI-based forensic suite

  • FTK Imager – Create and inspect forensic images

  • dd / dc3dd – Low-level disk imaging on Linux

  • EnCase – Commercial tool for deep disk investigations (basic familiarity)

๐Ÿ”น Memory Forensics

  • Volatility – Extract processes, DLLs, and sessions from RAM dumps

  • Rekall – Advanced volatile memory analysis

๐Ÿ”น Network Forensics

  • Wireshark – Protocol and packet analysis

  • tcpdump – Command-line traffic capture

  • NetworkMiner – Extracts files and sessions from PCAP files

๐Ÿ”น Log & Timeline Analysis

  • Timesketch – Timeline visualization and correlation

  • Plaso (log2timeline) – Converts raw logs into a forensic timeline

  • Sysinternals Suite – Live system inspection (Procmon, PsExec, Autoruns)

๐Ÿ”น Malware Analysis

  • Ghidra – Static reverse engineering

  • x64dbg / OllyDbg – Debuggers for binary inspection

  • Hybrid Analysis / VirusTotal – Behavioral analysis and threat intel

  • Cuckoo Sandbox – Automated dynamic malware analysis

๐Ÿ”น Cloud & Endpoint Forensics

  • AWS CloudTrail / GuardDuty – Monitor API and security activity

  • Microsoft Defender / Azure Logs – Cloud-native alerting and forensics

  • CrowdStrike Falcon / SentinelOne – EDR tools for endpoint activity and IOC collection

๐Ÿ”น Scripting & Automation

  • Python – For custom plugins, log parsers, automation

  • Bash / PowerShell – For system triage, memory dumps, and log collection

๐Ÿ”น Methodology

  • Align findings with MITRE ATT&CK

  • Follow structured DFIR frameworks like SANSNIST 800-61, and custom playbooks

๐ŸŽฏ Final Thoughts

Digital forensics isn’t just for breach responders — it’s a key skill for DevSecOps, SDETs, and any security-conscious engineer. Whether you’re building incident response workflows, simulating attacks, or validating your EDR, knowing how to collect and interpret evidence makes you far more effective.

Monday, July 28, 2025

๐Ÿ”ง Intercepting Android API Traffic with Burp Suite and a Rooted Emulator

Testing the security and behavior of Android apps often requires intercepting and analyzing API requests and responses. In this guide, we’ll walk through setting up an Android emulator to work with Burp Suite, enabling interception of HTTPS traffic and performing advanced manipulations like brute-force attacks.

⚠️ Requirements:

  • Android Emulator (AVD)
  • Root access (via Magisk)
  • Burp Suite (Community or Professional Edition)


๐Ÿ›  Step-by-Step Setup Guide

✅ 1. Install Burp Suite

  • Download Burp Suite Community Edition (2023.6.2) from PortSwigger.

  • Launch the app and navigate to:

    Proxy → Options → Proxy Listeners → Import/Export CA Certificate

✅ 2. Export and Install Burp CA Certificate

  1. Export the CA Certificate in DER format and save it with a .crt extension.

  2. Transfer this .crt file to your emulator (drag and drop works fine).

  3. On the emulator:

    • Open Settings → Security → Encryption & Credentials

    • Tap Install from SD card

    • Choose the transferred certificate.

  4. Confirm installation:

    • Go to Trusted Credentials → User and verify the certificate is listed.


๐Ÿ”“ 3. Root the Emulator

To trust user-installed certificates at the system level (bypassing Android’s certificate pinning), you must root the emulator.

Tools You’ll Need:

Rooting Process:

  1. Ensure your AVD is running before executing the root script.

  2. Unzip rootAVD and run the following command in terminal:

./rootAVD.sh ~/Library/Android/sdk/system-images/android-33/google_apis/arm64-v8a/ramdisk.img

  1. ✅ For Play Store-enabled AVDs, use google_apis_playstore in the path.
  2. Your emulator will shut down automatically after patching.


⚙️ 4. Install Magisk & Trust Certificates

  1. Restart your emulator and open the Magisk app.

  2. Navigate to Modules → Install from Storage → Select AlwaysTrustUserCerts.zip

  3. The emulator will restart again.

  4. Verify the certificate now appears under System certificates, not just User.


๐ŸŒ 5. Connect Emulator to Burp Suite

In Burp Suite:

  1. Go to Proxy → Options → Add Listener

  2. Choose an IP from the 172.x.x.x range.

  3. Set port to 8080 and click OK.

On the Emulator:

  1. Connect to Wi-Fi.

  2. Long press the connected Wi-Fi → Modify Network → Proxy: Manual

  3. Set:

    • Host: Burp Suite IP (e.g., 172.x.x.x)

    • Port: 8080

    • Save the changes.


๐Ÿš€ 6. Intercept Traffic

  • Launch your Android debug app.

  • Open HTTP History in Burp Suite to monitor incoming requests/responses.


๐ŸŽฏ Conclusion

You now have a fully configured Android emulator that allows you to:

  • Intercept and inspect HTTPS API traffic

  • Analyze request/response headers and payloads

  • Perform manual or automated security tests (e.g., brute force attacks)

This setup is ideal for mobile QA, security testing, or reverse engineering Android applications in a safe, isolated environment.


๐Ÿ’ฌ Feel free to bookmark or share this guide with fellow testers or developers diving into mobile app traffic inspection.
Happy hacking!

Tuesday, June 24, 2025

Performance Metrics Measure

Performance testing is only as effective as the metrics you measure and act on. In distributed systems, it’s not just about response time — it’s about end-to-end system behavior under loadresource utilization, and failure thresholds.


Here’s how I typically categorize and collect key performance testing metrics, based on my real-world experience with high-scale platforms.


✅ 1. Core Performance Metrics

Metric

Why It Matters

Throughput (TPS/QPS)

Measures system capacity — are we handling the expected load?

Latency (P50, P95, P99)

Helps detect tail latencies and slow paths. P99 is critical for user experience.

Error Rate (%)

Any spike under load suggests bottlenecks or instability.

Concurrency

Helps test thread safety and async processing under pressure.

Time to First Byte / Full Response

Important for APIs and UI performance perception.


✅ 2. Resource Utilization Metrics

Resource

Metric

Purpose

CPU

% Usage, context switches

Detect CPU-bound operations

Memory

Heap/Non-heap usage, GC pause time

Tune for memory leaks, OOM risk

Disk I/O

Read/write IOPS, latency

Ensure storage doesn’t become a bottleneck

Network

Throughput, packet loss, RTT

Catch bandwidth saturation, dropped packets

Thread Pools

Active threads, queue size

Avoid thread starvation under load


Tools used: PrometheusGrafanaNew Relictopvmstatiostatjstatjmapasync-profiler

✅ 3. Application-Specific Metrics

Component

Metrics to Monitor

Kafka

Consumer lag, messages/sec, ISR count

DB/Cache (e.g., Redis, Postgres)

Query latency, cache hit/miss, slow query logs

Elasticsearch

Query throughput, indexing rate, segment merges, node GC

Spark Jobs

Task duration, shuffle read/write, executor memory spill

API Layer

Response codes breakdown (2xx, 4xx, 5xx), rate-limited requests

✅ 4. Infrastructure & Cluster Health

Service

Key Indicators

Kubernetes

Pod restarts, node CPU/mem pressure, eviction count

Disk Space

Free space per node, inode usage

GC Behavior

GC frequency, full GC %, pause durations

Auto-scaling Logs

Scale-up/down events, throttle rates


✅ 5. Stability & Reliability Metrics

Category

Why It Matters

Test Flakiness Rate

Detects inconsistent behavior under load

Success % under chaos

How gracefully does the system degrade?

Retry Count / Circuit Breaker Trips

Signals downstream failures under load

Service Uptime %

Validates HA/resilience against failures


๐Ÿ”ง How I Collect & Analyze Metrics

  • Test Harness Integration: I integrate metrics collection directly into test frameworks (e.g., expose custom Prometheus counters in Java test harness).

  • Dashboards: Build tailored Grafana dashboards for real-time observability of test runs.

  • Thresholds & SLOs: Define thresholds for acceptable P95 latency, error rate, and resource usage — any breach flags a performance regression.

  • Baseline Comparison: Run nightly jobs to compare metrics vs. last known good release and flag deltas.

Saturday, September 11, 2021

Performance testing with Vegeta

Load testing is an important part of releasing a reliable API or application. Vegeta load testing will give you the confidence that the application will work well under a defined load. In this post, we will discuss how to use Vegeta for your load testing needs with some GET request examples. As it is just a go binary it is much easier to set up and use than you think, let's get started.

Loading a truck

What is Load testing?

Load testing in plain terms means testing an application by simulating some concurrent requests to determine the behavior of the application in the real world like scenario. Basically, it tests how the application will respond when multiple simultaneous users try to use the application.

There are many ways to load test applications/APIs and Vegeta is one of the easiest tools to perform load testing on your APIs or applications.

Prerequisites for this tutorial

Before jumping on the main topic let’s look at some prerequisites:

  • You are good with using the command line (installing and executing CLI apps)
  • Your application/API is deployed on a server (staging/production) to test it. Local tests are fine too still they might not give an accurate picture of how the server will behave on load.
  • You have some experience with load testing (may be used locust or Jmeter in the past)

Alternatives and why Vegeta

Load testing can be done in multiple ways, there are many different SAAS for load testing too. Still, locally installed tools are a great way to load test your application or API. I have used Locust in the past. The setup and execution are not as easy and straightforward as Vegeta.

Another option is to go with JMeter. Apache JMeter is a fully-featured load testing tool which also translates to knowing its concepts and having a steep learning curve.

Vegeta is a go-lang binary (and library) so installing and using it is a breeze. There are not many concepts to understand and learn.

To start with, simply provide a URL and give it how many requests per second you want the URL to be hit with. Vegeta will hit the URL with the frequency provided and can give the HTTP response codes and response time in an easy to comprehend graph.

The best thing about Vegeta is there is no need to install python or Java to get started. Next, let’s install Vegeta to begin Vegeta load testing.

Install Vegeta

Let us look at the official way Vegeta define itself:

Vegeta is a versatile HTTP load testing tool built out of a need to drill HTTP services with a constant request rate. It can be used both as a command-line utility and a library.

The easiest way to begin load testing with Vegeta is to download the right executable from its GitHub releases page. At the time of writing, the current version is v12.8.3.

Install on Linux

If you are on a 64-bit Linux you can make Vegeta work with the following set of commands:

cd ~/downloads

wget https://github.com/tsenart/vegeta/releases/download/v12.8.3/vegeta-12.8.3-linux-amd64.tar.gz

tar -zxvf vegeta-12.8.3-linux-amd64.tar.gz

chmod +x vegeta

./vegeta --version

If you want to execute Vegeta from any path, you can add a symlink to your path executing a command like ln -s ~/downloads/vegeta ~/bin/vegeta , then it will work on a new CLI tab.

Install on Mac

You can also install Vegeta on a Mac with the following command:

brew update && brew install vegeta

If you already have go-lang installed on your machine and GOBIN in your PATH, you can try to start your Vegeta load testing journey:

go get -u github.com/tsenart/vegeta

Check if it installed properly with:

vegeta --version

You should see a version number displayed.

Your first Vegeta load testing command

There are multiple ways to use the Vegeta load testing tool, one of the simplest ways to get the output on the command line for faster analysis. To your first Vegeta load testing command execute the following:

echo "GET http://httpbin.org/get" | vegeta attack -duration=5s -rate=5 | vegeta report --type=text

So what just happened here?

  1. We echoed the URL in this case httpbin.org/get and we passed it through Vegeta attack
  2. vegeta attack is the main command that ran the Vegeta load test with 5 requests per second for 5 seconds
  3. The last but equally important command executed was vegeta report get show the report of the attack as text.

You can see a sample output below:

Text output of 5 RPS for 5 seconds

Vegeta load testing tool ran the attack of 25 requests spread over 5 seconds at 5 RPS. The minimum response time was 240 ms and the maximum was 510 ms with a 100% success rate. This means all the requests came back as a 200. Further, let's have a look at how we can see a more graphical output.

Vegeta Load testing with graphical output

Another representation of Vegeta load testing results is an easy to understand graph. We can get a graph output with the below command:

cd && echo "GET http://httpbin.org/get" | vegeta attack -duration=30s -rate=10 -output=results-veg-httpbin-get.bin && cat results-veg-httpbin-get.bin | vegeta plot --title="HTTP Bin GET 10 rps for 30 seconds" > http-bin-get-10rps-30seconds.html

Let’s analyze how we used Vegeta for load testing httpbin.org here:

  1. We went to the user home with cd command
  2. Then we set up the URL for vegeta attack by echoing GET http://httpbin.org/get
  3. This step is when we “attack” (a.k.a load test) httpbin servers at 10 requests per second for 30 seconds duration (so in total 300 requests in 30 seconds) we also specified that we want the output at results-vegeta-httbin-get.bin file
  4. Now this result is like a binary that can’t be read easily so the next thing is we read the contents of this binary file with cat and passed it to vegeta plot with a fancy title and filename to get the HTML file
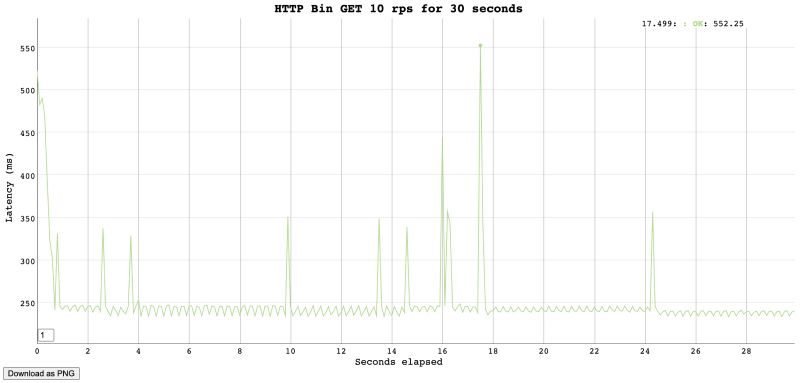
  5. When we open the created HTML file we can see a graph like below in the HTML file:
Graph output of 10 RPS for 30 seconds with Vegeta

So we sent 300 requests and all of them came back with a 200, the max response time was 552 milliseconds. One of the fastest response times was 234 milliseconds. This gives us a clear picture that HTTP bin can easily handle 10 requests per second for 30 seconds.

I would advise you to not try it many times, HTTPBin.org might block your IP thinking you are DDOSing their system.

Generally, you get the idea of how you use Vegeta for load testing your own services.

My service uses an Auth token

Well, all the services won’t be open to all, most will use a JWT or some other way to authenticate and authorize users. To test such services you can use a command like below:

cd && echo "GET http://httpbin.org/get" | vegeta attack -header "authorization: Bearer <your-token-here>" -duration=40s -rate=10 -output=results-veg-token.bin && cat results-veg-token.bin | vegeta plot --title="HTTP Get with token" > http-get-token.html

This example uses the same pattern as the above one, the main difference here is the use of -header param in the vegeta attack command used for Vegeta load testing.

If you want to test an HTTP POST with a custom body please refer to the Vegeta docs. It is best to test the GET APIs to know the load unless you have a write-heavy application/API.

How do I load test multiple URLs?

Testing multiple URLs with different HTTP methods is also relatively easy with Vegeta. Let’s have a look at this in the example below with a couple of GET requests:

  1. Create a targets.txt file (filename can be anything) with content like below that has a list of your URLs prefixed by the HTTP verb. In the one below I am load testing 3 GET URLs

                            GET http://httpbin.org/get

                            GET http://httpbin.org/ip


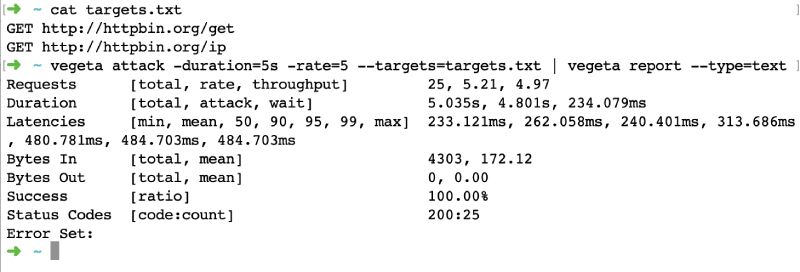
  1. Now similar to the first example with the text output run this command in the folder the targets.txt file is created: vegeta attack -duration=5s -rate=5 --targets=targets.txt | vegeta report --type=text
  2. We will see a text output like below:
Text output of multiple GET URLs with Vegeta

As we have seen doing load testing on multiple URLs with Vegeta is a breeze. Vegeta load testing can easily be done for other HTTP verbs like POST and PUT. Please refer to Vegeta docs.

Conclusion

This post was like scratching the surface with a primer on load testing with Vegeta. There are many advanced things that can be done with Vegeta load testing. Vegeta has been very useful on multiple occasions. I had once used Vegeta to load test Google Cloud Functions and Google Cloud Run with the same code to see the response time difference between those two for a talk. The graph comparing both the services made the difference crystal clear.

In another instance, we tested a new public-facing microservice that was replacing a part of an old monolith. It was very useful doing Vegeta load testing to know the response time difference for similar Request Per Second loads.

Load testing the application or API you want to go to production with is crucial.

We once had to open up an API to a much higher load than it would normally get. Our load testing with Vegeta really helped us determine the resources and level of horizontal scaling the API would need to work without issue.

All thanks to Vegeta it was much easier than using another tool or service.

Thursday, September 2, 2021

NFR Template/Checklist for JIRA


To make NFR as predefined template/checklist, we came up with few critical points to start with and it would be auto-populated as and when someone creates any story to the project.

Idea is to pushing NFR in initial phase discussion like designing and developing and as a cross check goes to QA. Apart from predefined template/checklist, anyone can work on other points too for which checklist already been published in Confluence under Guidelines and having predefined checklist in each story would ensure we are having NFR discussions too along with functional towards any deliverables to production.


NFR ListChecklist_PointsComments if any
Logging
Have we ensured we are not logging access logs?Access logs represent the request logs containing the API Path, status code, latencies & and any information about the request. We can avoid logging this since we already have this information in the istio-proxy logs
Have we ensured we didn't add any sort of secrets in logs (DB passwords, keys, etc) ?
Have we ensured that payload gets logged in the event of an error ?
Have we ensured that logging level can be dyanamic configured ?
Have we ensured that entire sequence of events in particular flow can be identified using an identifier like orderId or anything- The logs added should be meaningful enough such that anyone looking at the logs, regardless of whether they have context on the code should be able to understand the flow.
- For new features, it maybe important that the logs are logged as info to help ensure the feature is working is expected in production. Once we have confidence that the feature is working as expected, we could change these logs to debug unless required. Devs could take a call based on the requirement.
Have we ensured that we are using logging levels diligently ?
Timeouts
Have we ensured that we have set a timeout for database calls ?
Have we ensured that we have set a timeout for API call ?
Have we ensured that timeouts are derived from dependent component timeouts ?An API might have dependencies on few other components (APIs, DB queries, etc) internally. It is important the overall API timeout is considered after careful consideration of the dependent component timeouts.
Have we ensured that we have set a HTTP timeout ?Today, in most of our services we set timeouts at the client (caller). But we should also start looking at setting timeouts for requests on the server (callee). This way we ensure we kill the request in the server if it exceeds a timeout regardless of whether the client closes the connection or not.
Response Codes
Have we ensured that we are sending 2xx only for successfull scenarios ?
Have we ensured that we are sending 500 only for unexpected errors (excluding timeouts) ?
Have we ensured that we are sending 504 for a timeout error ?
Perf
Have we ensured that we did perf testing of any new API we build to get benchmark of the same we can go as per the expectations and can track accordingly going forward ?
We should identify below parameters as part of the perf test & any other additional info as per need:
- Max number of requests a pod can handle with the allocated resources
- CPU usage
- Memory usage
- Response times


Have we ensured we did perf testing of existing APIs if there are changes around it to make sure we didn’t impact existing benchmark results ?
Feature ToggleHave we ensured that we have feature toggle for new features to be able to go back to the old state at any given point until we are confident of the new changes. We may need to have toggles like feature will be enabled for specific users or city ?
ResiliencyHave we ensured that we are resilient to failures of dependent components (database, services ) ?
MetricsHave we ensured that we are capturing the right metrics in prometheous ?Below are some of the metrics that could be captured based on need or criticality:
- Business metrics (example: number of payment gateway failures)
- Business logic failures (example: number of rider prioritization requests that failed)
- Or any other errors which would be important to help assess the impact in a critical flow could be captured as metrics.
Security
Have we ensured that right authentication scheme is active at the gateway level ?This is applicable when we are adding any end point on Kong(Gateway). 
- any of the authentication plugins (jwt,key-auth/basic-auth) must be defined either at the route level or on the service level
- for gateway kong end points, acl plugin must be added and same group must be present on the consumer definition.
Have we ensured that proper rate limiting applied at the gateway level ?This is applicable when we are adding any end point on Kong(Gateway).Team leads are the code owners, so one of them have to check this when approving the PR. 
- rate limiting plugin needs to be enabled on the route / service level on the PR raised against kong-config. 
Have we ensured that we are retreiving the userId from JWT ?if requests is coming from kong, userid in requestbody should be matched with headers. Or for fetching any user related information, we have to read the userId only from the header populated by kong (x-consumer-username).


It would be populated in all Jira stories across projects as a predefined NFR checklist as given below screenshot.


My Profile

My photo
can be reached at 09916017317