Showing posts with label Resiliency Testing. Show all posts

Sunday, August 3, 2025

Getting Started with Mobile Security Framework (MobSF) for Mobile App Security Testing


Mobile application security is no longer optional—it’s essential.
 Whether you’re an Android, iOS, or Windows mobile developer, integrating automated security assessments into your CI/CD pipeline can drastically improve your app’s resilience against attacks. Enter MobSF (Mobile Security Framework)—an all-in-one toolkit for performing static and dynamic analysis of mobile apps.

In this guide, we’ll walk through setting up MobSF using Docker on macOS with Colima and demonstrate how to conduct both static and dynamic analysis.


๐Ÿš€ What is MobSF?

Mobile Security Framework (MobSF) is an open-source, automated mobile application pentesting, malware analysis, and security assessment tool. It supports:

  • Static & dynamic analysis

  • Mobile binaries: .apk.ipa.appx.xapk

  • Source code (zipped)

  • REST APIs for CI/CD or DevSecOps integration

Whether you’re running tests during development or before release, MobSF provides valuable insights into the security posture of your app.


๐Ÿ›  Prerequisites

Before starting, ensure the following tools are installed on your macOS system:

  • Colima – Docker Desktop alternative for macOS

  • Docker

Installation Commands:

brew install colima
brew install docker
colima start

๐Ÿงช Running MobSF with Docker

Once Colima and Docker are set up, launch MobSF using the following command:

docker run -it --rm -p 8000:8000 opensecurity/mobile-security-framework-mobsf:latest


๐ŸŒ Accessing the MobSF Dashboard

After launching MobSF, the terminal logs will include a line like:

Listening at: http://127.0.0.1:8000

Copy this URL into your browser to open the MobSF dashboard.

Uploading an App:

Simply drag and drop your APK/IPA file into the dashboard to begin static analysis.


๐Ÿงพ Static Analysis

Once uploaded, MobSF automatically scans the app and generates a security report. Monitor the Docker logs to verify successful completion or identify potential issues during analysis.

Sample Reports:

  • AppSec Scorecard for Prod Build (v2.9.8)

  • Full Static Analysis Report

✅ These reports help developers and security teams identify code-level vulnerabilities, permission misuses, and more.


๐Ÿ” Dynamic Analysis

MobSF’s dynamic analysis enables runtime behavior assessment, allowing you to detect malicious operations or insecure runtime behaviors.

๐Ÿ”ง Requirements:

  • Emulator without Google Play Store

  • API level ≤ 28 (Android 9)

Step 1: Start Emulator

Navigate to your SDK tools directory and run:

cd ~/Library/Android/sdk/tools

./emulator -avd Pixel_5_API_28 -writable-system -no-snapshot

To list available AVDs:

emulator -list-avds

Step 2: Launch MobSF with Emulator Identifier

Find your emulator’s ID using:

adb devices

Then start MobSF with the emulator bound:

docker run -e MOBSF_ANALYZER_IDENTIFIER="emulator-5554" -it --rm -p 8000:8000 opensecurity/mobile-security-framework-mobsf:latest

Step 3: Start Dynamic Analysis

In the MobSF UI:

  • Go to Dynamic Analyzer

  • Click Start Dynamic Analysis

MobSF will initiate an interactive test session connected to your emulator.


✅ Final Thoughts

MobSF is a powerful and developer-friendly framework for mobile app security. With minimal setup, it provides:

  • Actionable security insights

  • Seamless CI/CD integration

  • Both static and dynamic testing capabilities

By integrating MobSF into your development lifecycle, you ensure your mobile applications are secure, compliant, and robust.


๐Ÿ“Ž Useful Links


Tuesday, July 29, 2025

๐Ÿ“Š Mobile App Testing Metrics: What Every Senior QA Engineer Should Track


In today’s mobile-first world, quality isn’t just about “does it work?” — it’s about performance, stability, and experience across thousands of devices and real-world conditions.

In this post, I’ll break down the essential mobile app testing metrics across both functional and non-functional categories, and share why each is critical for modern QA teams.


✅ Functional Testing Metrics (Ensuring the App Works as Expected)

Functional metrics validate how well your app delivers expected features. These metrics give you confidence that the app is ready for real users.

  • Test Case Coverage: Helps you measure how much of the app’s core workflows are validated through test cases (manual or automated).

  • Pass/Fail Rate: Tells you how stable the build is. A high failure rate signals instability or regression.

  • Defect Density: Tracks how many bugs are found per feature or module. It’s useful for identifying hotspots or weak areas in the app.

  • Bug Reopen Rate: Measures how often closed bugs reappear. A high reopen rate suggests incomplete fixes or misunderstood issues.

  • Automation Coverage: Indicates what percentage of tests are automated. It helps identify areas that can benefit from automation for faster regression cycles.

  • Crash Reproduction Rate: Reflects how reliably testers can reproduce reported crashes — critical for triaging user-submitted issues.

  • Exploratory Testing Insights: Captures notes and findings from unscripted testing, often revealing usability issues and edge cases.


๐Ÿš€ Non-Functional Testing Metrics (Ensuring the App is Fast, Stable, and Safe)

Non-functional testing metrics focus on performance, stability, and overall experience — factors that directly influence user retention and app ratings.

  • App Start Time: Measures how long the app takes to open, especially after a cold launch. Anything over 2 seconds can degrade the user experience.

  • Memory Usage & Leaks: Helps detect memory spikes or leaks that could lead to slowdowns or crashes, especially on low-end devices.

  • Battery Consumption: Evaluates how the app affects device battery life — a key concern for mobile users.

  • Crash & ANR Rate: Tracks how often the app crashes or becomes unresponsive. Tools like Firebase Crashlytics or Sentry can monitor this in real time.

  • Network Performance: Focuses on how the app behaves under different network conditions (3G, 4G, offline, etc.). Includes API latency and error rates.

  • App Size & Load Time: Larger apps take longer to install and may deter users from downloading. It’s also a factor in emerging markets with limited storage or data.

  • Security Metrics: Includes how securely the app handles sensitive data (e.g., token storage, permission usage, SSL pinning).

  • Push Notification Delivery Rate: Measures the reliability of push notifications, especially when the app is in background or killed state.

  • Session Length & Retention Indicators: While often tracked by product teams, these are useful for QA when analyzing how app performance impacts user behavior.


๐Ÿ›  Tools I Use to Track These Metrics

To track these metrics efficiently, I use a combination of industry-standard tools:

  • Test execution & automation: TestRail, Zephyr, Xray, Allure

  • Automation & CI/CD: Appium, Espresso, Detox, Jenkins, GitHub Actions

  • Crash reporting & performance monitoring: Firebase Crashlytics, Sentry, New Relic

  • Security scanning: OWASP Mobile Checklist, MobSF, Burp Suite

  • User analytics & behavior: Mixpanel, PostHog, Google Analytics for Firebase


๐Ÿ“ˆ Metrics I Include in QA Dashboards or Release Reports

When summarizing test results for stakeholders or leadership, I often include:

  • The number of tests executed, passed, failed, or skipped

  • Automation health (execution duration, flaky test rate)

  • High-priority defect trends across sprints or builds

  • Distribution of failures by device, OS version, or app module

  • Crash-free session rates post-deployment

  • Memory, startup time, and battery benchmarks over releases


๐ŸŽฏ Final Thoughts

Mobile testing isn’t just about clicking buttons—it’s about measuring what matters. The right metrics help QA teams move from reactive testers to proactive quality advocates. Whether you’re testing a fintech app in Singapore or a delivery platform in Indonesia, these metrics help you build confidence, ship faster, and improve user satisfaction at scale.

Monday, July 28, 2025

๐Ÿ”ง Intercepting Android API Traffic with Burp Suite and a Rooted Emulator

Testing the security and behavior of Android apps often requires intercepting and analyzing API requests and responses. In this guide, we’ll walk through setting up an Android emulator to work with Burp Suite, enabling interception of HTTPS traffic and performing advanced manipulations like brute-force attacks.

⚠️ Requirements:

  • Android Emulator (AVD)
  • Root access (via Magisk)
  • Burp Suite (Community or Professional Edition)


๐Ÿ›  Step-by-Step Setup Guide

✅ 1. Install Burp Suite

  • Download Burp Suite Community Edition (2023.6.2) from PortSwigger.

  • Launch the app and navigate to:

    Proxy → Options → Proxy Listeners → Import/Export CA Certificate

✅ 2. Export and Install Burp CA Certificate

  1. Export the CA Certificate in DER format and save it with a .crt extension.

  2. Transfer this .crt file to your emulator (drag and drop works fine).

  3. On the emulator:

    • Open Settings → Security → Encryption & Credentials

    • Tap Install from SD card

    • Choose the transferred certificate.

  4. Confirm installation:

    • Go to Trusted Credentials → User and verify the certificate is listed.


๐Ÿ”“ 3. Root the Emulator

To trust user-installed certificates at the system level (bypassing Android’s certificate pinning), you must root the emulator.

Tools You’ll Need:

Rooting Process:

  1. Ensure your AVD is running before executing the root script.

  2. Unzip rootAVD and run the following command in terminal:

./rootAVD.sh ~/Library/Android/sdk/system-images/android-33/google_apis/arm64-v8a/ramdisk.img

  1. ✅ For Play Store-enabled AVDs, use google_apis_playstore in the path.
  2. Your emulator will shut down automatically after patching.


⚙️ 4. Install Magisk & Trust Certificates

  1. Restart your emulator and open the Magisk app.

  2. Navigate to Modules → Install from Storage → Select AlwaysTrustUserCerts.zip

  3. The emulator will restart again.

  4. Verify the certificate now appears under System certificates, not just User.


๐ŸŒ 5. Connect Emulator to Burp Suite

In Burp Suite:

  1. Go to Proxy → Options → Add Listener

  2. Choose an IP from the 172.x.x.x range.

  3. Set port to 8080 and click OK.

On the Emulator:

  1. Connect to Wi-Fi.

  2. Long press the connected Wi-Fi → Modify Network → Proxy: Manual

  3. Set:

    • Host: Burp Suite IP (e.g., 172.x.x.x)

    • Port: 8080

    • Save the changes.


๐Ÿš€ 6. Intercept Traffic

  • Launch your Android debug app.

  • Open HTTP History in Burp Suite to monitor incoming requests/responses.


๐ŸŽฏ Conclusion

You now have a fully configured Android emulator that allows you to:

  • Intercept and inspect HTTPS API traffic

  • Analyze request/response headers and payloads

  • Perform manual or automated security tests (e.g., brute force attacks)

This setup is ideal for mobile QA, security testing, or reverse engineering Android applications in a safe, isolated environment.


๐Ÿ’ฌ Feel free to bookmark or share this guide with fellow testers or developers diving into mobile app traffic inspection.
Happy hacking!

Saturday, December 21, 2024

[Chaoskube] Resiliency Testing in Kubernetes


Chaoskube is a tool used to introduce chaos engineering principles into Kubernetes clusters. It randomly terminates pods in a cluster to test the resilience and reliability of the system. By simulating unexpected failures, Chaoskube helps ensure that applications and services are robust and can recover gracefully.

Key Features of Chaoskube

1. Random Pod Termination:

Chaoskube randomly selects and deletes pods within a Kubernetes cluster at regular intervals.

2. Namespace and Label Filtering:

You can restrict which pods Chaoskube targets by specifying namespaces or labels.

3. Exclusion Rules:

Specific pods, namespaces, or labels can be excluded from termination to prevent disruption to critical components.

4. Time Window Scheduling:

Allows chaos experiments to run only during specific timeframes, avoiding disruptions during critical business hours.

5. Configurable Chaos:

Parameters like interval and grace period can be customized to control the frequency and behavior of pod termination.

6. Dry Run Mode:

Chaoskube can simulate chaos without actually deleting pods, allowing safe testing.


How Chaoskube Works

1. Pod Selection:

Chaoskube queries the Kubernetes API to list all pods in the cluster.

Filters are applied based on namespaces, labels, or exclusion rules.

2. Random Termination:

A pod is selected at random from the filtered list and terminated using Kubernetes’ delete API.

3. Chaos Frequency:

The interval for termination is configurable (e.g., every 30 seconds or 5 minutes).


Use Cases

1. Resilience Testing:

Ensure that your applications can handle unexpected pod failures and recover automatically.

2. Load Balancer Testing:

Verify that load balancers redistribute traffic effectively when a pod goes down.

3. Fault Tolerance Validation:

Test the robustness of failover mechanisms and redundancy strategies.

4. Continuous Chaos:

Integrate Chaoskube into CI/CD pipelines for continuous resilience testing.


Installation and Usage


1. Install Chaoskube

Deploy Chaoskube in your Kubernetes cluster using Helm or a YAML manifest.


2. Example YAML Configuration

apiVersion: apps/v1

kind: Deployment

metadata:

  name: chaoskube

  namespace: chaos-testing

spec:

  replicas: 1

  selector:

    matchLabels:

      app: chaoskube

  template:

    metadata:

      labels:

        app: chaoskube

    spec:

      containers:

      - name: chaoskube

        image: linki/chaoskube:latest

        args:

        - --interval=10s

        - --namespace=default

        - --labels=app=example

        - --dry-run=false

3. Key Parameters

--interval: Time between pod terminations (e.g., 10s, 1m).

--namespace: Target specific namespaces.

--labels: Target pods with specific labels.

--dry-run: Simulate chaos without actually deleting pods. 


Best Practices

1. Start Small:

Begin with a dry-run mode to understand the impact of chaos experiments.

2. Use Exclusions:

Exclude critical pods, namespaces, or labels to avoid disruptions to essential services.

3. Monitor and Observe:

Use monitoring tools like Prometheus and Grafana to observe the system’s behavior during chaos experiments.

4. Time Constraints:

Schedule chaos experiments during non-critical hours to minimize business impact.

5. Gradual Increase:

Gradually increase the frequency and scope of chaos experiments as your system matures.


Benefits of Using Chaoskube

Improved Resilience:

Identify weaknesses in your system and improve recovery mechanisms.

Proactive Failure Handling:

Prepare for real-world failures by simulating them in a controlled environment.

Continuous Improvement:

Build confidence in the reliability of your applications and infrastructure.


Conclusion

Chaoskube is a lightweight and effective tool for introducing chaos engineering into Kubernetes environments. By simulating pod failures, it helps teams build more resilient systems capable of handling real-world disruptions.

Saturday, September 11, 2021

Performance testing with Vegeta

Load testing is an important part of releasing a reliable API or application. Vegeta load testing will give you the confidence that the application will work well under a defined load. In this post, we will discuss how to use Vegeta for your load testing needs with some GET request examples. As it is just a go binary it is much easier to set up and use than you think, let's get started.

Loading a truck

What is Load testing?

Load testing in plain terms means testing an application by simulating some concurrent requests to determine the behavior of the application in the real world like scenario. Basically, it tests how the application will respond when multiple simultaneous users try to use the application.

There are many ways to load test applications/APIs and Vegeta is one of the easiest tools to perform load testing on your APIs or applications.

Prerequisites for this tutorial

Before jumping on the main topic let’s look at some prerequisites:

  • You are good with using the command line (installing and executing CLI apps)
  • Your application/API is deployed on a server (staging/production) to test it. Local tests are fine too still they might not give an accurate picture of how the server will behave on load.
  • You have some experience with load testing (may be used locust or Jmeter in the past)

Alternatives and why Vegeta

Load testing can be done in multiple ways, there are many different SAAS for load testing too. Still, locally installed tools are a great way to load test your application or API. I have used Locust in the past. The setup and execution are not as easy and straightforward as Vegeta.

Another option is to go with JMeter. Apache JMeter is a fully-featured load testing tool which also translates to knowing its concepts and having a steep learning curve.

Vegeta is a go-lang binary (and library) so installing and using it is a breeze. There are not many concepts to understand and learn.

To start with, simply provide a URL and give it how many requests per second you want the URL to be hit with. Vegeta will hit the URL with the frequency provided and can give the HTTP response codes and response time in an easy to comprehend graph.

The best thing about Vegeta is there is no need to install python or Java to get started. Next, let’s install Vegeta to begin Vegeta load testing.

Install Vegeta

Let us look at the official way Vegeta define itself:

Vegeta is a versatile HTTP load testing tool built out of a need to drill HTTP services with a constant request rate. It can be used both as a command-line utility and a library.

The easiest way to begin load testing with Vegeta is to download the right executable from its GitHub releases page. At the time of writing, the current version is v12.8.3.

Install on Linux

If you are on a 64-bit Linux you can make Vegeta work with the following set of commands:

cd ~/downloads

wget https://github.com/tsenart/vegeta/releases/download/v12.8.3/vegeta-12.8.3-linux-amd64.tar.gz

tar -zxvf vegeta-12.8.3-linux-amd64.tar.gz

chmod +x vegeta

./vegeta --version

If you want to execute Vegeta from any path, you can add a symlink to your path executing a command like ln -s ~/downloads/vegeta ~/bin/vegeta , then it will work on a new CLI tab.

Install on Mac

You can also install Vegeta on a Mac with the following command:

brew update && brew install vegeta

If you already have go-lang installed on your machine and GOBIN in your PATH, you can try to start your Vegeta load testing journey:

go get -u github.com/tsenart/vegeta

Check if it installed properly with:

vegeta --version

You should see a version number displayed.

Your first Vegeta load testing command

There are multiple ways to use the Vegeta load testing tool, one of the simplest ways to get the output on the command line for faster analysis. To your first Vegeta load testing command execute the following:

echo "GET http://httpbin.org/get" | vegeta attack -duration=5s -rate=5 | vegeta report --type=text

So what just happened here?

  1. We echoed the URL in this case httpbin.org/get and we passed it through Vegeta attack
  2. vegeta attack is the main command that ran the Vegeta load test with 5 requests per second for 5 seconds
  3. The last but equally important command executed was vegeta report get show the report of the attack as text.

You can see a sample output below:

Text output of 5 RPS for 5 seconds

Vegeta load testing tool ran the attack of 25 requests spread over 5 seconds at 5 RPS. The minimum response time was 240 ms and the maximum was 510 ms with a 100% success rate. This means all the requests came back as a 200. Further, let's have a look at how we can see a more graphical output.

Vegeta Load testing with graphical output

Another representation of Vegeta load testing results is an easy to understand graph. We can get a graph output with the below command:

cd && echo "GET http://httpbin.org/get" | vegeta attack -duration=30s -rate=10 -output=results-veg-httpbin-get.bin && cat results-veg-httpbin-get.bin | vegeta plot --title="HTTP Bin GET 10 rps for 30 seconds" > http-bin-get-10rps-30seconds.html

Let’s analyze how we used Vegeta for load testing httpbin.org here:

  1. We went to the user home with cd command
  2. Then we set up the URL for vegeta attack by echoing GET http://httpbin.org/get
  3. This step is when we “attack” (a.k.a load test) httpbin servers at 10 requests per second for 30 seconds duration (so in total 300 requests in 30 seconds) we also specified that we want the output at results-vegeta-httbin-get.bin file
  4. Now this result is like a binary that can’t be read easily so the next thing is we read the contents of this binary file with cat and passed it to vegeta plot with a fancy title and filename to get the HTML file
  5. When we open the created HTML file we can see a graph like below in the HTML file:
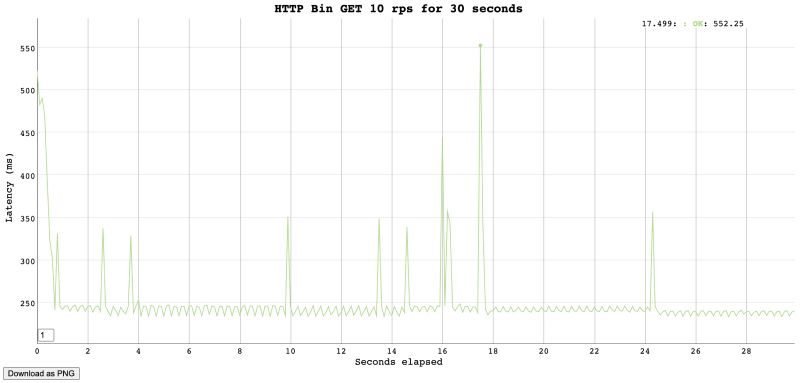
Graph output of 10 RPS for 30 seconds with Vegeta

So we sent 300 requests and all of them came back with a 200, the max response time was 552 milliseconds. One of the fastest response times was 234 milliseconds. This gives us a clear picture that HTTP bin can easily handle 10 requests per second for 30 seconds.

I would advise you to not try it many times, HTTPBin.org might block your IP thinking you are DDOSing their system.

Generally, you get the idea of how you use Vegeta for load testing your own services.

My service uses an Auth token

Well, all the services won’t be open to all, most will use a JWT or some other way to authenticate and authorize users. To test such services you can use a command like below:

cd && echo "GET http://httpbin.org/get" | vegeta attack -header "authorization: Bearer <your-token-here>" -duration=40s -rate=10 -output=results-veg-token.bin && cat results-veg-token.bin | vegeta plot --title="HTTP Get with token" > http-get-token.html

This example uses the same pattern as the above one, the main difference here is the use of -header param in the vegeta attack command used for Vegeta load testing.

If you want to test an HTTP POST with a custom body please refer to the Vegeta docs. It is best to test the GET APIs to know the load unless you have a write-heavy application/API.

How do I load test multiple URLs?

Testing multiple URLs with different HTTP methods is also relatively easy with Vegeta. Let’s have a look at this in the example below with a couple of GET requests:

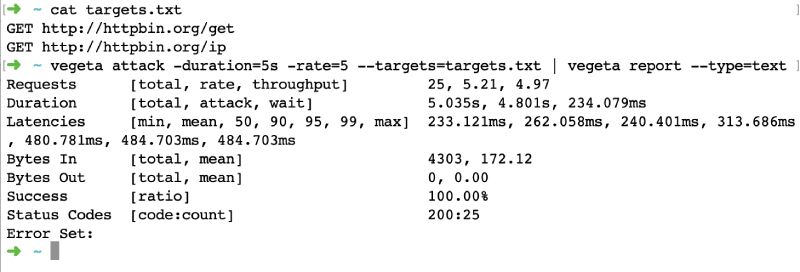
  1. Create a targets.txt file (filename can be anything) with content like below that has a list of your URLs prefixed by the HTTP verb. In the one below I am load testing 3 GET URLs

                            GET http://httpbin.org/get

                            GET http://httpbin.org/ip


  1. Now similar to the first example with the text output run this command in the folder the targets.txt file is created: vegeta attack -duration=5s -rate=5 --targets=targets.txt | vegeta report --type=text
  2. We will see a text output like below:
Text output of multiple GET URLs with Vegeta

As we have seen doing load testing on multiple URLs with Vegeta is a breeze. Vegeta load testing can easily be done for other HTTP verbs like POST and PUT. Please refer to Vegeta docs.

Conclusion

This post was like scratching the surface with a primer on load testing with Vegeta. There are many advanced things that can be done with Vegeta load testing. Vegeta has been very useful on multiple occasions. I had once used Vegeta to load test Google Cloud Functions and Google Cloud Run with the same code to see the response time difference between those two for a talk. The graph comparing both the services made the difference crystal clear.

In another instance, we tested a new public-facing microservice that was replacing a part of an old monolith. It was very useful doing Vegeta load testing to know the response time difference for similar Request Per Second loads.

Load testing the application or API you want to go to production with is crucial.

We once had to open up an API to a much higher load than it would normally get. Our load testing with Vegeta really helped us determine the resources and level of horizontal scaling the API would need to work without issue.

All thanks to Vegeta it was much easier than using another tool or service.

My Profile

My photo
can be reached at 09916017317