Search This Blog

Showing posts with label Performance Testing. Show all posts

Saturday, September 11, 2021

Performance testing with Vegeta

Load testing is an important part of releasing a reliable API or application. Vegeta load testing will give you the confidence that the application will work well under a defined load. In this post, we will discuss how to use Vegeta for your load testing needs with some GET request examples. As it is just a go binary it is much easier to set up and use than you think, let's get started.

Loading a truck

What is Load testing?

Load testing in plain terms means testing an application by simulating some concurrent requests to determine the behavior of the application in the real world like scenario. Basically, it tests how the application will respond when multiple simultaneous users try to use the application.

There are many ways to load test applications/APIs and Vegeta is one of the easiest tools to perform load testing on your APIs or applications.

Prerequisites for this tutorial

Before jumping on the main topic let’s look at some prerequisites:

  • You are good with using the command line (installing and executing CLI apps)
  • Your application/API is deployed on a server (staging/production) to test it. Local tests are fine too still they might not give an accurate picture of how the server will behave on load.
  • You have some experience with load testing (may be used locust or Jmeter in the past)

Alternatives and why Vegeta

Load testing can be done in multiple ways, there are many different SAAS for load testing too. Still, locally installed tools are a great way to load test your application or API. I have used Locust in the past. The setup and execution are not as easy and straightforward as Vegeta.

Another option is to go with JMeter. Apache JMeter is a fully-featured load testing tool which also translates to knowing its concepts and having a steep learning curve.

Vegeta is a go-lang binary (and library) so installing and using it is a breeze. There are not many concepts to understand and learn.

To start with, simply provide a URL and give it how many requests per second you want the URL to be hit with. Vegeta will hit the URL with the frequency provided and can give the HTTP response codes and response time in an easy to comprehend graph.

The best thing about Vegeta is there is no need to install python or Java to get started. Next, let’s install Vegeta to begin Vegeta load testing.

Install Vegeta

Let us look at the official way Vegeta define itself:

Vegeta is a versatile HTTP load testing tool built out of a need to drill HTTP services with a constant request rate. It can be used both as a command-line utility and a library.

The easiest way to begin load testing with Vegeta is to download the right executable from its GitHub releases page. At the time of writing, the current version is v12.8.3.

Install on Linux

If you are on a 64-bit Linux you can make Vegeta work with the following set of commands:

cd ~/downloads

wget https://github.com/tsenart/vegeta/releases/download/v12.8.3/vegeta-12.8.3-linux-amd64.tar.gz

tar -zxvf vegeta-12.8.3-linux-amd64.tar.gz

chmod +x vegeta

./vegeta --version

If you want to execute Vegeta from any path, you can add a symlink to your path executing a command like ln -s ~/downloads/vegeta ~/bin/vegeta , then it will work on a new CLI tab.

Install on Mac

You can also install Vegeta on a Mac with the following command:

brew update && brew install vegeta

If you already have go-lang installed on your machine and GOBIN in your PATH, you can try to start your Vegeta load testing journey:

go get -u github.com/tsenart/vegeta

Check if it installed properly with:

vegeta --version

You should see a version number displayed.

Your first Vegeta load testing command

There are multiple ways to use the Vegeta load testing tool, one of the simplest ways to get the output on the command line for faster analysis. To your first Vegeta load testing command execute the following:

echo "GET http://httpbin.org/get" | vegeta attack -duration=5s -rate=5 | vegeta report --type=text

So what just happened here?

  1. We echoed the URL in this case httpbin.org/get and we passed it through Vegeta attack
  2. vegeta attack is the main command that ran the Vegeta load test with 5 requests per second for 5 seconds
  3. The last but equally important command executed was vegeta report get show the report of the attack as text.

You can see a sample output below:

Text output of 5 RPS for 5 seconds

Vegeta load testing tool ran the attack of 25 requests spread over 5 seconds at 5 RPS. The minimum response time was 240 ms and the maximum was 510 ms with a 100% success rate. This means all the requests came back as a 200. Further, let's have a look at how we can see a more graphical output.

Vegeta Load testing with graphical output

Another representation of Vegeta load testing results is an easy to understand graph. We can get a graph output with the below command:

cd && echo "GET http://httpbin.org/get" | vegeta attack -duration=30s -rate=10 -output=results-veg-httpbin-get.bin && cat results-veg-httpbin-get.bin | vegeta plot --title="HTTP Bin GET 10 rps for 30 seconds" > http-bin-get-10rps-30seconds.html

Let’s analyze how we used Vegeta for load testing httpbin.org here:

  1. We went to the user home with cd command
  2. Then we set up the URL for vegeta attack by echoing GET http://httpbin.org/get
  3. This step is when we “attack” (a.k.a load test) httpbin servers at 10 requests per second for 30 seconds duration (so in total 300 requests in 30 seconds) we also specified that we want the output at results-vegeta-httbin-get.bin file
  4. Now this result is like a binary that can’t be read easily so the next thing is we read the contents of this binary file with cat and passed it to vegeta plot with a fancy title and filename to get the HTML file
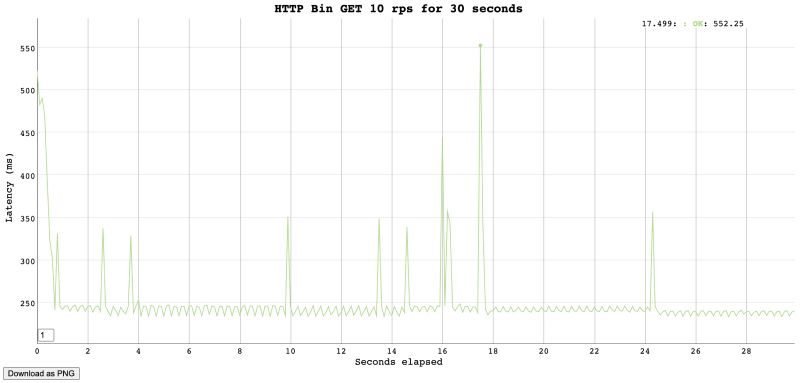
  5. When we open the created HTML file we can see a graph like below in the HTML file:
Graph output of 10 RPS for 30 seconds with Vegeta

So we sent 300 requests and all of them came back with a 200, the max response time was 552 milliseconds. One of the fastest response times was 234 milliseconds. This gives us a clear picture that HTTP bin can easily handle 10 requests per second for 30 seconds.

I would advise you to not try it many times, HTTPBin.org might block your IP thinking you are DDOSing their system.

Generally, you get the idea of how you use Vegeta for load testing your own services.

My service uses an Auth token

Well, all the services won’t be open to all, most will use a JWT or some other way to authenticate and authorize users. To test such services you can use a command like below:

cd && echo "GET http://httpbin.org/get" | vegeta attack -header "authorization: Bearer <your-token-here>" -duration=40s -rate=10 -output=results-veg-token.bin && cat results-veg-token.bin | vegeta plot --title="HTTP Get with token" > http-get-token.html

This example uses the same pattern as the above one, the main difference here is the use of -header param in the vegeta attack command used for Vegeta load testing.

If you want to test an HTTP POST with a custom body please refer to the Vegeta docs. It is best to test the GET APIs to know the load unless you have a write-heavy application/API.

How do I load test multiple URLs?

Testing multiple URLs with different HTTP methods is also relatively easy with Vegeta. Let’s have a look at this in the example below with a couple of GET requests:

  1. Create a targets.txt file (filename can be anything) with content like below that has a list of your URLs prefixed by the HTTP verb. In the one below I am load testing 3 GET URLs

                            GET http://httpbin.org/get

                            GET http://httpbin.org/ip


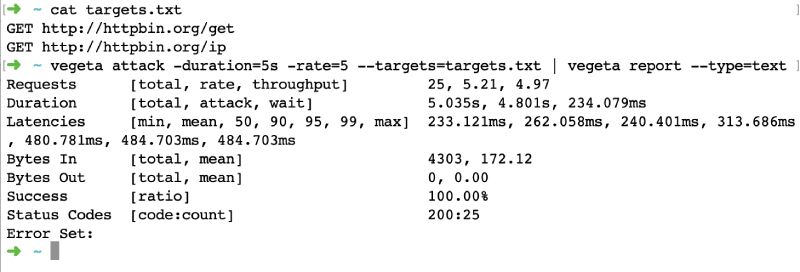
  1. Now similar to the first example with the text output run this command in the folder the targets.txt file is created: vegeta attack -duration=5s -rate=5 --targets=targets.txt | vegeta report --type=text
  2. We will see a text output like below:
Text output of multiple GET URLs with Vegeta

As we have seen doing load testing on multiple URLs with Vegeta is a breeze. Vegeta load testing can easily be done for other HTTP verbs like POST and PUT. Please refer to Vegeta docs.

Conclusion

This post was like scratching the surface with a primer on load testing with Vegeta. There are many advanced things that can be done with Vegeta load testing. Vegeta has been very useful on multiple occasions. I had once used Vegeta to load test Google Cloud Functions and Google Cloud Run with the same code to see the response time difference between those two for a talk. The graph comparing both the services made the difference crystal clear.

In another instance, we tested a new public-facing microservice that was replacing a part of an old monolith. It was very useful doing Vegeta load testing to know the response time difference for similar Request Per Second loads.

Load testing the application or API you want to go to production with is crucial.

We once had to open up an API to a much higher load than it would normally get. Our load testing with Vegeta really helped us determine the resources and level of horizontal scaling the API would need to work without issue.

All thanks to Vegeta it was much easier than using another tool or service.

Thursday, September 2, 2021

NFR Template/Checklist for JIRA


To make NFR as predefined template/checklist, we came up with few critical points to start with and it would be auto-populated as and when someone creates any story to the project.

Idea is to pushing NFR in initial phase discussion like designing and developing and as a cross check goes to QA. Apart from predefined template/checklist, anyone can work on other points too for which checklist already been published in Confluence under Guidelines and having predefined checklist in each story would ensure we are having NFR discussions too along with functional towards any deliverables to production.


NFR ListChecklist_PointsComments if any
Logging
Have we ensured we are not logging access logs?Access logs represent the request logs containing the API Path, status code, latencies & and any information about the request. We can avoid logging this since we already have this information in the istio-proxy logs
Have we ensured we didn't add any sort of secrets in logs (DB passwords, keys, etc) ?
Have we ensured that payload gets logged in the event of an error ?
Have we ensured that logging level can be dyanamic configured ?
Have we ensured that entire sequence of events in particular flow can be identified using an identifier like orderId or anything- The logs added should be meaningful enough such that anyone looking at the logs, regardless of whether they have context on the code should be able to understand the flow.
- For new features, it maybe important that the logs are logged as info to help ensure the feature is working is expected in production. Once we have confidence that the feature is working as expected, we could change these logs to debug unless required. Devs could take a call based on the requirement.
Have we ensured that we are using logging levels diligently ?
Timeouts
Have we ensured that we have set a timeout for database calls ?
Have we ensured that we have set a timeout for API call ?
Have we ensured that timeouts are derived from dependent component timeouts ?An API might have dependencies on few other components (APIs, DB queries, etc) internally. It is important the overall API timeout is considered after careful consideration of the dependent component timeouts.
Have we ensured that we have set a HTTP timeout ?Today, in most of our services we set timeouts at the client (caller). But we should also start looking at setting timeouts for requests on the server (callee). This way we ensure we kill the request in the server if it exceeds a timeout regardless of whether the client closes the connection or not.
Response Codes
Have we ensured that we are sending 2xx only for successfull scenarios ?
Have we ensured that we are sending 500 only for unexpected errors (excluding timeouts) ?
Have we ensured that we are sending 504 for a timeout error ?
Perf
Have we ensured that we did perf testing of any new API we build to get benchmark of the same we can go as per the expectations and can track accordingly going forward ?
We should identify below parameters as part of the perf test & any other additional info as per need:
- Max number of requests a pod can handle with the allocated resources
- CPU usage
- Memory usage
- Response times


Have we ensured we did perf testing of existing APIs if there are changes around it to make sure we didn’t impact existing benchmark results ?
Feature ToggleHave we ensured that we have feature toggle for new features to be able to go back to the old state at any given point until we are confident of the new changes. We may need to have toggles like feature will be enabled for specific users or city ?
ResiliencyHave we ensured that we are resilient to failures of dependent components (database, services ) ?
MetricsHave we ensured that we are capturing the right metrics in prometheous ?Below are some of the metrics that could be captured based on need or criticality:
- Business metrics (example: number of payment gateway failures)
- Business logic failures (example: number of rider prioritization requests that failed)
- Or any other errors which would be important to help assess the impact in a critical flow could be captured as metrics.
Security
Have we ensured that right authentication scheme is active at the gateway level ?This is applicable when we are adding any end point on Kong(Gateway). 
- any of the authentication plugins (jwt,key-auth/basic-auth) must be defined either at the route level or on the service level
- for gateway kong end points, acl plugin must be added and same group must be present on the consumer definition.
Have we ensured that proper rate limiting applied at the gateway level ?This is applicable when we are adding any end point on Kong(Gateway).Team leads are the code owners, so one of them have to check this when approving the PR. 
- rate limiting plugin needs to be enabled on the route / service level on the PR raised against kong-config. 
Have we ensured that we are retreiving the userId from JWT ?if requests is coming from kong, userid in requestbody should be matched with headers. Or for fetching any user related information, we have to read the userId only from the header populated by kong (x-consumer-username).


It would be populated in all Jira stories across projects as a predefined NFR checklist as given below screenshot.


NFR Checklist - Cheatsheet

As a test engineer, our core responsibility to make sure we go through NFR checklist for each and every ticket we test and we ship any feature or change to production. Resiliency testing play a key role in microservice architecture. Let’s work towards that actively and build our system resilient.

Software resilience testing is a method of software testing that focuses on ensuring that applications will perform well in real-life or chaotic conditions. In other words, it tests an application’s resiliency, or ability to withstand stressful or challenging factors. Resilience testing is one part of non-functional software testing that also includes compliance, endurance, load and recovery testing. This form of testing is sometimes also referred to as software resilience engineering, application resilience testing or chaos engineering.

Since failures can never be avoided, resilience testing ensures that software can continue performing core functions and avoid data loss even when under stress. Especially as customer expectations are becoming higher and downtime can be detrimental to the success of an organization, it is crucial to minimize disruptions and be prepared for unwanted scenarios. Resilience testing can be considered one part of an organization’s business continuity plan.


Please follow below checklist as part of your regular testing

  • Logging

    • Add appropriate logging towards any feature and any changes so we can debug any issue anytime later.

    • At the same time avoid adding unnecessary logging which are not needed for the changes.

    • Use INFO, WARNING, DEBUG and ERROR cautiously in the logging.

  • Events in CT

    • Add CT events wherever it’s quite necessary to collect actions about users so we can take appropriate action based on user actions.

  • SPOF (Single Point of Failure)

    • While building feature get an overall understanding of e2e flow and figure it out if this component or service fails, whole system or flow will go down along with it.

  • Security (Credential Mgmt)

  • Error Handling

    • Add appropriate logging for any kind of error which can happen towards feature or any change.

    • Test it out with diff set of data and how error handled at the API end apart from expected set of data.

  • Timeouts

    • Timeouts will help you fail fast if any of your downstream services does not reply back within, say 1ms.

    • It helps to prevent Cascading failures.

  • Retries

    • Retries can help reduce recovery time. They are very effective when
      dealing with intermittent failures.

    • Retries works well in conjunction with timeouts, when you timeout you
      retry the request.

  • Fallbacks

    • When there are faults in your systems, choose to use alternative
      mechanisms to respond with a degraded response instead of failing
      completely.

  • Circuit Breaker

    • Circuit breakers are used in households to prevent sudden surge in current
      preventing house from burning down. These trip the circuit and stop flow of current.

    • This same concept could be applied to our distributed systems wherein you stop making calls to downstream services when you know that the system is unhealthy and failing and allow it to recover.

    • Circuit breakers are required at integration points, help preventing cascading
      failures allowing the failing service to recover.

  • Performance testing

    • Do perf testing of any new API we build to get benchmark of the same we can go as per the expectations and can track accordingly going forward.

    • Do perf testing of existing APIs if there are changes around it to make sure we didn’t impact existing benchmark results.

  • Failure injection testing

    • Test your services via inject faults at integration points to verify how resilient is your service and entire system along with it.

  • Health Check

    • Add health check for all the services and make sure it’s up all the time.

My Profile

My photo
can be reached at 09916017317